

 Confido Legal


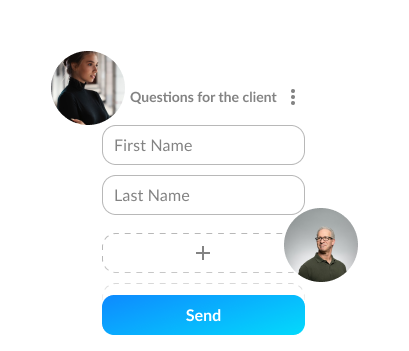


A simple time tracking built for speed and ease of use. Ability to add flat fee entries to your legal practice management system.


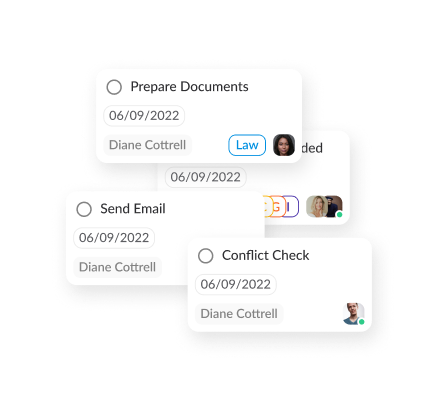
Tired of creating the same tasks every time? Handle repetitive tasks automatically that can sometimes fall through the cracks.


© 2015-2024, Lawcus Inc. All rights are reserved.